
Where differences create opportunities
Decarbonization starts with what can be changed
Chemistry, supply routes and factory conditions shape where reductions are possible. A product footprint becomes useful when it is traced to variables a business can choose or control.
Material sourcing shapes procurement opportunities
For products dominated by material emissions, trace mineral processing and active-material routes. Compare specific products, locations and production conditions, rather than ranking suppliers on headline numbers alone.
Factory efficiency needs qualified output as context
Analyze process energy, utilities, operating load and yield together. Lower total energy use does not always mean better unit performance: production volume and product mix also affect the result.
Circular benefits depend on actual displacement
The next use of recovered material, the virgin input it displaces and the added treatment burden determine the net benefit. Recovered tonnage alone does not establish carbon value.
Procurement determines which upstream processes enter a product. Manufacturing determines how inputs become qualified output. Recycling changes the source of materials in the next cycle. Their combined effect must be assessed for the same product.
Identify the main sources of emissions, establish which variables can change, then compare the net benefits of feasible options. Collect data in the same order, prioritizing gaps that could change the decision.
Connect accounting to procurement, production and material recovery to make better choices.
Sources: IEA, 2024 · Machala et al., 2025
Turn one footprint into three decisions
The business value of a product footprint lies in explaining how different choices change the same product.
Procurement
Source · Route · Substitution
Build a set of eligible material options
Production
Energy · Load · Yield
Identify measurable process improvements
R&D
Formulation · Design · Service
Test connected effects across the product
Procurement compares materials that meet performance and supply requirements. Production identifies where energy use and losses occur. R&D assesses whether changes to formulation, design or processing affect life and quality. These questions can share data, but a total footprint cannot answer them all.
Start with a product that has a clear business need. Connect its bill of materials, production line and supply routes so that analysis leads to specific sourcing options, measurement tasks and trials.
Define the choice to be changed before defining the data to collect.
The boundary determines whether a comparison holds
A cell, a battery pack and a lifetime of service involve different inputs and deliver different functions.
Raw materials
Processing and material production
Cell gate
Qualified capacity and specification
Battery pack
Structure and system integration
Use and end of life
Service, lifetime and treatment
Materials and manufacturing → factory gate; changes to performance and life → equivalent service.
Material and manufacturing improvements can first be compared from raw-material extraction to qualified cells at the factory gate. If an option also changes pack design, use-phase efficiency or service life, include those changes in the relevant modules.
Rated capacity, usable capacity and lifetime energy delivered are different denominators. Procurement options for the same specification can be compared at the factory gate. Products delivering the same service require performance, operating conditions and replacement needs to be assessed together. Set the boundary and functional unit before ranking options.
Begin the comparison with equivalent delivery requirements.
Sources: WRI / WBCSD, 2011
Bring material differences into procurement
Battery chemistry changes where to look first
NMC emissions are more concentrated in upstream materials; manufacturing contributes a larger share for LFP. Priorities depend on the process and energy conditions of each system.
Mineral processing
Active materials
Cell manufacturing
Shares are approximate. A further 5% for NMC is not shown.
IEA analysis points to different emission profiles for the two chemistries. For NMC, mineral processing and active-material production warrant early attention. For LFP, manufacturing and its energy supply merit close examination.
Shares show where an investigation might begin; they do not rank the total footprints of the two chemistries. Actual sourcing and factory data are needed to establish the hotspots of a specific product.
Procurement: compare equivalent materials
Assess mineral sources, refining routes and supplier energy conditions. Establish a set of options with equivalent performance and supply conditions before estimating substitution benefits.
Manufacturing: connect energy to output
Analyze process energy, utility loads and yield together. Use qualified output to interpret energy intensity, then assess efficiency improvements and lower-carbon electricity in combination.
Sources: IEA, 2024
Make supplier differences comparable
Equivalent performance and reliable supply are prerequisites. Carbon data should explain the differences between eligible materials and whether those differences can benefit the product.
| Dimension | Difference to explain | Evidence for the decision |
|---|---|---|
| Material and route | Mineral sources, refining and precursor processes | Process data for the specific product and location |
| Energy and time | Electricity, heat and production period | Energy quantities, factors and applicable year |
| Accounting basis | Boundary, allocation and background data version | Methods and reproducible inputs |
| Substitution conditions | Performance, qualification, supply and losses | Eligible materials and achievable replacement share |
The same material name does not imply the same production route, energy mix or accounting boundary. Separate these sources of difference before attributing an apparent advantage to production performance.
Qualification, batch consistency and available volume constrain the achievable substitution rate. Only the change that can actually enter the product counts toward procurement-related reductions.
Compare options that can enter the product
Use quality, supply and qualification conditions to define the candidate set.
Keep carbon evidence current
Update evidence when feedstocks, energy or processes change.
Explain the source of a difference before calculating an achievable benefit.
Sources: WRI / WBCSD, 2011
Look beyond the cathode to connected effects
The benefits of material reduction or substitution need to be tested across the complete cell.
Material option
Quantity, specification and formulation
Processing
Operating window and energy
Qualified output
Yield, quality and performance
Net effect
Update all affected inputs
Record materials, energy and quality in the same trial so that connected changes enter the model.
Include copper and aluminum foils, graphite, electrolyte, separators and auxiliary materials alongside the cathode. Preserve the relationship between purchased quantities, process inputs, qualified output and scrap destinations to identify losses and omissions.
Thinner foil or a different formulation may change the processing window, yield and in-use performance. Update the affected manufacturing parameters when assessing an option. Counting only the reduction in one material can miss extra energy or losses; cross-functional trials establish whether those effects change the net benefit.
Test a local material improvement against the complete product.
Local process data makes differences traceable
Background data describes upstream processes. Company records establish the actual route taken by a product.
Raw-material acquisition and pretreatment
Principal product production
End-of-life treatment and recycling
214 processes / 3,197 flows / 53 sources
The China-specific lithium-ion battery dataset compiles 214 processes and 3,197 flows from 53 sources. The associated paper groups the processes into raw-material acquisition and pretreatment, principal product production, and end-of-life treatment and recycling: 75, 52 and 87 processes respectively.
Bills of materials, supply sources and energy measurements should describe actual foreground processes. Match background processes by geography, technology, year and boundary. Existing data provides a traceable starting point for gaps; it does not remove the need for matching or for replacing critical assumptions with measurements.
Start with traceable background data; strengthen the model with critical measurements.
Sources: Tian et al., 2024 · Xie et al., 2024 · Gao et al., 2025
Connect energy use to qualified output
Manufacturing reductions start with every unit of energy
The same energy bill can reflect different volumes, product mixes and operating stages. Connect consumption to qualified output to identify improvements that can last.
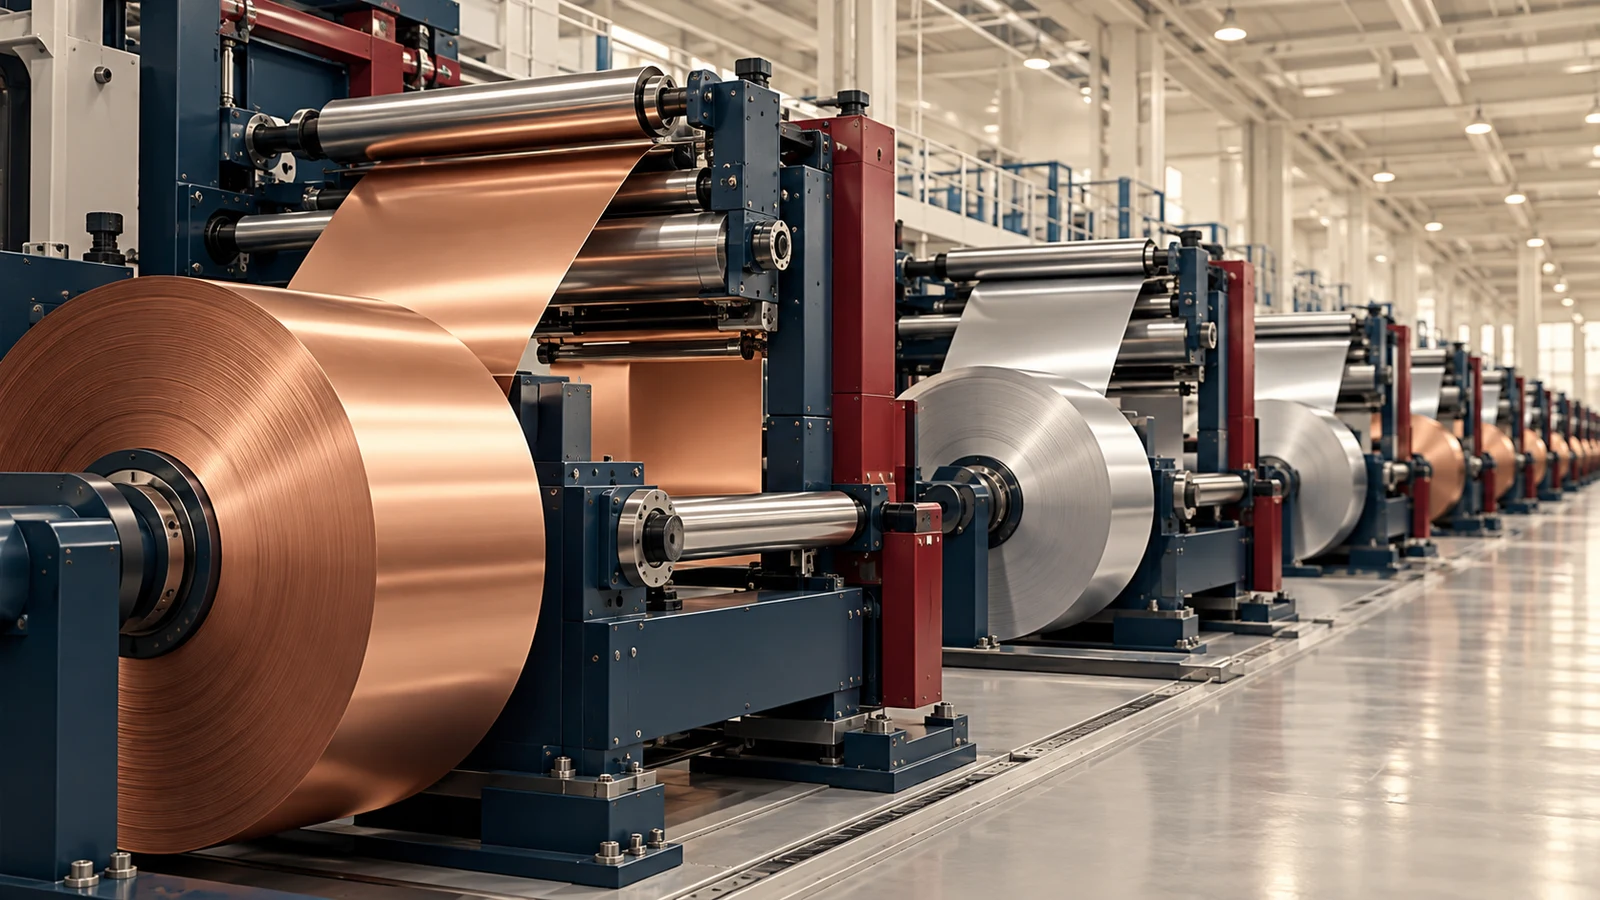
Align process metering, utility consumption and production records in time. Base loads such as controlled dry environments do not necessarily fall in proportion to output. Low utilization can raise the burden per unit, while yield affects both material and energy requirements.
Keep product specification and quality conditions consistent when evaluating a trial. Explain operating volume and stage, and distinguish equipment efficiency, capacity utilization and quality improvements before extending results to other lines.
Process energy
Meter coating, drying, formation and other operations to locate the actual hotspots.
Shared utilities
Connect dry-environment and auxiliary-system loads to the relevant lines and periods.
Qualified output
Record volume, yield and product mix alongside energy use to explain changes in intensity.
Align the process, time period and qualified product before choosing an investment.
Sources: Degen et al., 2023 · Knehr et al., 2024
Research gives scale. Metering guides investment.
Differences between manufacturing energy models need to be interpreted alongside process and operating conditions.
kWh production energy / kWh cell capacity; excludes material extraction and refining.
In the manufacturing model by Degen et al., nickel-based cells require approximately 20-29 kWh of production energy per kWh of cell capacity, compared with 37.5 for LFP. The figures exclude material extraction and refining. They describe a particular model, not a universal factory target or a ranking of total battery footprints.
On site, separate electricity and heat, and identify coating and drying, formation, dry environments and auxiliary loads. Where submetering is absent, start with measurements that explain the main variations rather than expanding reporting fields indiscriminately.
Measure where the data can explain a difference and support an action.
Sources: Degen et al., 2023 · Knehr et al., 2024
Yield changes both material and energy burdens
Where a loss occurs determines how much burden qualified output must carry.
Initial input
Materials enter production
Processing
Energy accumulates
Late-stage losses
Rework or rejection
Qualified output
Carries the remaining burden
Track inputs, rework and rejects at critical stages, including scrap destinations.
The same quantity of scrap can have different implications before processing and after most manufacturing steps are complete. Record inputs, transfers, rework and rejects at critical stages rather than using a factory-wide yield to explain every loss.
Include avoided losses, rework energy and scrap treatment in the assessment. If higher yield requires longer processing or extra treatment, recalculate the net change per unit of qualified output. An improvement in one percentage alone does not establish the environmental benefit.
Locate the loss before calculating the net benefit of an improvement.
Separate base loads from production effects
Observe output, operating time and energy together. A single energy-intensity figure can conceal different operating causes.
Base energy
Environment and auxiliary systems
Process energy
Inputs that vary with production
Qualified output
Same period and product mix
Energy intensity = (base energy + process energy) / qualified output
Separate energy needed to maintain the environment and auxiliary systems from energy that varies with processing, then relate both to qualified output. Neither category is perfectly fixed or linear in practice: the distinction helps identify relationships that need measurement and testing.
If qualified output grows faster than base energy demand, the burden per unit can fall without an improvement in equipment efficiency. Align product mix, operating hours, environmental requirements and yield to distinguish volume effects from process changes.
Explain the roles of efficiency, output and quality in any fall in energy intensity.
Sources: Degen et al., 2023 · Knehr et al., 2024
Efficiency and cleaner power act on the same burden
Record energy quantities and emission factors separately, then recalculate the combined result from the underlying inputs.
Q0 × f0
Baseline electricity emissions
Q1 × f1
Electricity emissions after changes
Q: electricity quantity; f: applicable factor. Net reduction = Q0f0 - Q1f1.
Reducing electricity use and lowering its applicable emission factor both affect electricity-related emissions. Adding benefits calculated separately against the original baseline double-counts part of the reduction. Multiply the updated quantity by the updated factor to obtain the combined burden.
Keep physical supply, contractual evidence, applicable periods and accounting rules connected. Corporate purchased-electricity reporting and product footprints can follow different requirements. Buying an electricity instrument does not automatically determine its treatment in every product declaration.
Update the quantity and the factor, then calculate the combined result once.
Sources: GHG Protocol, 2015
Make circular materials displace virgin inputs
Circular value is realized in the next material choice
Recovery becomes connected to product decarbonization when output from a recycler becomes usable input for a manufacturer.

A circular route must answer three questions: where the feedstock comes from, what quality the recovered output achieves and what it displaces in the next production cycle. A break at any interface can separate recovered quantity from actual displacement.
Connect collection, pretreatment, refining, quality confirmation and reintegration. This reveals added energy, losses and transport, and identifies which steps need joint validation with the downstream user.
Identify feedstock
Distinguish production scrap from end-of-life batteries, including composition and collection conditions.
Confirm quality
Match recovered output specifications to the requirements of the next production process.
Verify displacement
Calculate net change using the actual next use and feasible substitution share.
Sources: Machala et al., 2025 · WRI / WBCSD, 2011
Recycling benefits depend on the route and its outputs
Environmental performance needs to be traced to feedstock, products and energy conditions.
kg CO2e / kg NCA-equivalent; mainly 2021 data, with different output forms.
Machala et al. compare industrial recycling and primary-material supply chains. Their gate-to-gate refining results are 14.5, 6.1 and 2.8 kg CO2e per kg NCA-equivalent for the primary route, end-of-life battery recycling and production-scrap recycling respectively. Data is mainly from 2021. Outputs are equivalent in elemental content, but differ in product form.
The findings support separate assessment of feedstock and processing conditions. Production scrap and end-of-life batteries are not interchangeable inputs. Match collection, pretreatment and refining steps to the proposed route, then assess whether its actual conditions support a comparable direction of benefit.
Research identifies a possibility; matching the route determines whether it transfers.
Sources: Machala et al., 2025
Beyond recovery rates: what is displaced?
Recovered material enters a substitution analysis only to the extent that it changes subsequent production inputs.
Added burdens
Collection · Transport · Treatment
Conditions for producing and using recovered output
Avoided burdens
The virgin route actually displaced
Match quality, application and substitution share
For substitution analysis: net change = added minus avoided burdens; specify allocation separately.
Define the quality, destination and feasible substitution share of each recovered material. Battery-grade use and other applications imply different comparison objects. Recovered output is not automatically equal to avoided virgin input.
Net effects depend on added collection, treatment and transport, together with the burden of the route actually displaced. Align boundaries, time periods and product functions. For multiple recovered products, explain allocation so that the same benefit is not claimed repeatedly by different parties.
Compare a circular option with the production route it actually changes.
Sources: WRI / WBCSD, 2011
From cells to service, lifetime changes the comparison
A lower manufacturing footprint does not necessarily mean a lower impact for equivalent service.
Manufacturing
Initial product inputs
Operation
Efficiency and actual use
Lifetime
Degradation and replacement
Service
Equivalent delivery requirements
The functional unit should reflect the decision, not merely the most convenient denominator.
When a material or product option affects lifetime, efficiency or replacement frequency, extend the comparison to the same service. Stationary storage requires actual cycling, degradation and operating conditions; traction batteries need to match the vehicle service being considered.
Manufacturing and use can share basic data while retaining distinct boundaries and assumptions. Avoid applying a single per-kWh ranking across applications. The useful result states the uses and operating conditions under which an advantage persists.
Carry the manufacturing advantage through equivalent service to complete the comparison.
Sources: WRI / WBCSD, 2011
Turn opportunities into a workable portfolio
Map the connections before combining the benefits
Materials, processes and energy choices can change the same underlying activity.
Material substitution
Supply factor ↔ Processing conditions
Yield improvement
Material input ↔ Energy per unit
Operating changes
Utilization ↔ Base-load allocation
Use one updated set of inputs for the combined option; count each physical change once.
Lower-carbon materials may alter processing conditions. Higher yield may reduce material demand. Changes in line operation may affect energy allocated per unit. Update connected parameters rather than changing only the most favorable input for each measure.
Combination analysis reveals reinforcing effects, double counting and added burdens. Record what changed, why it changed and which inputs were held constant so that the model can be matched to a real trial.
Include connected changes to make combined benefits relevant to implementation.
Close the gaps that could change the choice
The sensitivity of a decision should determine the priority of data collection.
| Stable ranking | Stronger evidence | Proceed to feasibility and trial validation |
|---|---|---|
| Stable ranking | Evidence gaps | Confirm critical boundaries and applicability |
| Reversible ranking | Stronger evidence | Make the choice conditional on scenarios |
| Reversible ranking | Evidence gaps | Measure the inputs that may change the conclusion |
Vary supply factors, energy use, yield and substitution shares within plausible ranges and observe whether the ranking changes. A parameter that reverses the conclusion after a small change deserves early verification. Ranges must reflect feasible conditions, not an arbitrary combination of favorable assumptions.
If the ranking remains stable across plausible conditions, proceed to feasibility testing. If it reverses readily, obtain stronger evidence first. This sequence directs data effort toward action rather than assigning equal priority to every gap.
The next piece of data should help resolve the next decision.
Bring carbon, cost and quality into one decision
A lower-carbon option must also meet product and business requirements.
| Product and supply | Performance, quality, qualification, availability | Define feasible options |
|---|---|---|
| Net environmental effect | Aligned boundary, interactions, sensitivity | Identify conditional advantages |
| Business and delivery | Investment, operating cost, timing, ownership | Plan trials and investment |
For the same product and production baseline, identify additional investment, energy and material savings, maintenance, qualification and operating changes. Cost and environmental scenarios should share physical inputs while retaining their own price, lifetime and accounting assumptions.
Screen technical feasibility, performance and supply conditions before comparing net reductions and incremental costs. Near-term operating improvements and long-term capital projects need not compete in one ranking. Organize actions by readiness and timescale to connect them to investment and production plans.
Meet product requirements first, then sequence lower-carbon actions by readiness.
Start with one product and keep improving
Start with one product. Build a repeatable path.
Connect scope, evidence, options and validation so that each step produces something the next can use.
The first product should have a clear sourcing or production question, reasonably complete records and accountable owners. Define its specification, factory, time period and decision purpose at the start to prevent scope from expanding during data collection.
Progress depends on evidence and validation conditions. Each stage leaves a transferable output: scope, baseline and gaps, candidate options, and trial results. Schedule qualification, equipment adjustments and lifetime testing around their actual requirements.
- 01Scope and decision objective
Define one decision
Select the product, factory and application, and the procurement or production choice to be supported.
- 02Reproducible baseline and hotspots
Build a common baseline
Connect materials, energy, output and sources. Close the gaps most likely to change the conclusion.
- 03Candidate options and trial conditions
Compare feasible options
Include performance, supply and cost constraints. Test interactions and sensitive inputs.
- 04Verified results and update process
Validate and update
Recalculate actual changes consistently, then extend effective practices to product families and supply networks.
The next product update should build on the data and methods already established.
Make the first analysis useful for the next one
A maintainable data package explains why results change.
Original records
Quantity · Unit · Period
Process links
Product · Line · Source
Model version
Factor · Rule · Parameter
Change in results
Production · Data · Method
Every update should be traceable to inputs, calculations and reasons for change.
Retain original quantities, units, sources, periods, applicable products and owners. Manage calculation relationships and background factors separately, with results tied to input versions. Updates can then distinguish production improvements, data replacement and methodological changes.
Define update triggers for supply sources, production processes and background factors. After a supplier change, a shift in output mix or a data revision, rerun the model consistently and attribute the difference to specific causes. The same data package can then support the next sourcing decision, product iteration or factory improvement.
Preserve the ability to update the analysis, not only its results.
Build quality checks into the work
Verification starts with inputs and continues through the model to the conclusion.
Inputs
Do material and energy records reconcile?
Cross-check purchases, inventories, production and scrap.
Model
Are relationships and units consistent?
Check duplicate processes, allocation, conversions and linked inputs.
Claims
Does the conclusion fit the intended use?
Check boundaries, sources, applicability and validation needs.
Use purchasing, inventory, output and waste records to reconcile major material flows, and energy and production records to explain loads. Investigate anomalies before comparing options so that missing data or changing definitions are not mistaken for improvements.
Model checks cover units, duplicated processes, allocation and parameter relationships. External claims need their boundaries, evidence and intended use checked. Confirm the validation requirements for customer communication, comparative claims and regulatory submissions separately.
Make each conclusion traceable to the relevant process and evidence.
Sources: WRI / WBCSD, 2011
Bring research and data into the next decision
Material selection, factory improvement and circular routes can each begin with a specific question.
Materials
What explains supplier differences?
Connect routes, methods and feasible substitution.
Manufacturing
Where does the energy change occur?
Connect metering, load, yield and qualified output.
Circularity
What does recovery actually displace?
Connect recovered quality, actual use and displaced routes.
Start with the product, the current choice and the available data. Are supplier differences difficult to explain? Is manufacturing energy hard to locate? Is the net benefit of a circular route unclear? Define the decision before selecting the processes and evidence to connect.
China-specific unit-process data and product-footprint research provide a published methodological foundation. Connecting that foundation to actual company records can support a baseline, contribution analysis, conditional options and a validation path. Explore the public research and team at Tiangong Discover.
Build a shared analytical foundation around one clearly defined question.
Sources: Tian et al., 2024 · Gao et al., 2025
Methods and sources
Keep the comparison on a consistent basis
Use every quantitative result with its boundary, functional unit and data period.
| Object and function | Same product or equivalent service | Specify denominator and performance |
|---|---|---|
| Scope and time | Processes, factory and production period | Explain inclusions and exclusions |
| Data and method | Technology, geography, allocation, data version | Retain reproducible inputs |
| Results and interpretation | Totals, contributions, scenarios, limits | Do not rank totals using stage shares |
Production comparisons center on qualified cells at the factory gate. Add separate modules for changes to packs, use or end-of-life treatment. For options with different performance or life, establish equivalent service requirements. Match background processes by technology, geography, time and boundary, retaining replacement records.
Cite literature results with their original boundaries and data periods; recalculate company options using actual product and process data. Retain scenario inputs, equations and conditions, distinguishing production changes from data updates. Stage shares describe contribution patterns, not the ranking of total product footprints.
A consistent basis makes changes interpretable.
Sources: WRI / WBCSD, 2011
Reuse the inputs. Check each reporting purpose.
Internal improvement, customer communication and regulatory submissions can share inputs while following their applicable rules.
| Internal improvement | Actual processes and controllable variables | Support sourcing and production choices |
|---|---|---|
| Customer communication | Agreed basis and required evidence | Make results explainable and checkable |
| Regulatory submission | Product category, timing and applicable rules | Verify methods and validation for each obligation |
Battery passport: manage applicability and effective dates field by field.
The start of the EU battery passport and the obligations for different information fields have distinct applicability dates. Check product categories, carbon footprints, recycled content and other fields separately instead of assigning one date to every obligation.
Manage each field through its source, owner, update frequency and access permissions. Once the reporting purpose is defined, verify the applicable calculation method, validation procedure and legal text, and maintain version links to the internal improvement model.
Use a common data foundation while meeting the requirements of each purpose.
Sources: European Commission, 2026 · European Commission, 2026-08-21 · European Union, 2026-08-13
What evidence does the next decision need?
Bring the research back to a specific product and use testable conditions to choose the next step.
Confirm the product and scope, then select a variable that can change. A material substitution, process improvement or circular route can be the starting point. Preserve a chain of evidence from inputs through changes to results.
If an advantage depends on an unverified condition, measure or test it next. If it remains stable within plausible ranges and meets quality and supply requirements, proceed to the corresponding implementation plan.
Consistent scope
Are the comparison objects, functional unit, factory and time period aligned?
Explainable differences
Does the change reflect production conditions, or different data and methods?
Feasible substitution
Are performance, supply, qualification and replacement shares achievable?
Credible net effect
Are added burdens, parameter interactions and uncertainty included?
Repeatable results
Who updates the inputs, when is the model rerun and how are changes verified?
References
- China-specific unit process dataset for lithium-ion batteries ↗Tian et al. · 2024
- China-specific Lithium-ion Battery Unit Process Dataset, v1 ↗Xie et al. · 2024
- Localized product carbon footprint accounting in China: The lithium-ion battery industry ↗Gao et al. · 2025
- Global EV Outlook 2024: Outlook for emissions reductions ↗IEA · 2024
- Energy consumption of current and future production of lithium-ion and post lithium-ion battery cells ↗Degen et al. · 2023
- Energy consumption of lithium-ion pouch cell manufacturing plants ↗Knehr et al. · 2024
- Life cycle comparison of industrial-scale lithium-ion battery recycling and mining supply chains ↗Machala et al. · 2025
- Product Life Cycle Accounting and Reporting Standard: Chapters 6 and 9 ↗WRI / WBCSD · 2011
- Scope 2 Guidance ↗GHG Protocol · 2015
- EU Digital Product Passport FAQ for Batteries ↗European Commission · 2026
- Guidance to support preparations for the Digital Batteries Passport ↗European Commission · 2026-08-21
- Regulation (EU) 2023/1542, consolidated text ↗European Union · 2026-08-13